

At Ndevr we are constantly rethinking just about every process we’ve ever used. This includes how we monitor the performance of projects before, during and after launch. We are getting the opportunity to try out some newer tools and techniques, as well as begin to customize some of them in our preferred development workflow. The Ndevr team created a Vagrant script that provisions a local virtual machine for monitoring, graphing and even dash boarding performance data.
We found some sample scripts out there, but couldn’t find an all in one solution that would provide a near seamless installation for quickly monitoring your local projects/sites. We’ve posted our work in a GitHub project named Devstack Performance. We will continue to update this project as we add additional features and functionality. You’ll be using the following tools with this setup:
Sitespeed.io
Sitespeed.io is an open source tool that helps you analyze your website speed and performance based on performance best practices and timing metrics. It collects data from multiple pages on your website, analyzes them using the rules and outputs the result as HTML or send the metrics to Graphite.
Graphite
Graphite is a highly scalable real-time graphing system. As a user, you write an application that collects numeric time-series data that you are interested in graphing, and send it to Graphite’s processing backend, carbon, which stores the data in Graphite’s specialized database. The data can then be visualized through graphite’s web interfaces.
Grafana
Grafana is an open source, feature rich metrics dashboard and graph editor for Graphite, InfluxDB & OpenTSDB. While the Graphite graphs and dashboards were sufficient for most use cases we like the cleaner and more robust query/metric building tools found in Grafana, and can’t wait to test it out more thoroughly in the future.
Selenium
![]()
![]()
Selenium automates browsers. That’s it! What you do with that power is entirely up to you. Primarily, it is for automating web applications for testing purposes, but is certainly not limited to just that. Boring web-based administration tasks can (and should!) also be automated as well.
Vagrant
Vagrant provides easy to configure, reproducible, and portable work environments built on top of industry-standard technology and controlled by a single consistent workflow to help maximize the productivity and flexibility of you and your team.
Vagrant Host Manager
A Vagrant plugin that manages the /etc/hosts file on guests within a multi-machine environment.
Instructions
Here’s the steps and results you’ll immediately see. It’s possible the instructions below become outdated as we continue to update the project. The most accurate documentation will always live on GitHub.
1) Install Vagrant
While this can generally be a very quick process, each local environment is different and the best docs are on the vagrant site: http://docs.vagrantup.com/v2/installation/.
2) Install Vagrant Host Manager
We use this simply because it adds entries for graphite, grafana and sitespeed to point to your VM’s IP address automatically when you provision the VM.
3) Clone Devstack Performance Repository
This contains everything needed to spin up an instance on your local machine, it currently requires 2 Gb of memory and takes about 7-10 minutes to provision the VM the first time.
git clone https://github.com/ndevrinc/devstack-performance
cd devstack-performance
vagrant up
And now you wait… Once the provisioning scripts complete fully it will begin to record metrics for http://www.sitespeed.io every 5 minutes. If you’d like feel free to edit the provision/files/sample_cron.sh file before you vagrant up, or simply edit it on the box afterwards. Assuming your hosts entries were updated properly you should be able to pull up these pages in a browser:
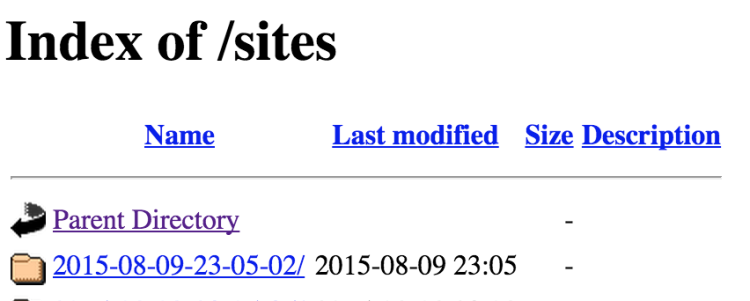
Sitespeed Results
http://sitespeed (simply shows browse-able doc structure to display the sitespeed.io HTML files)
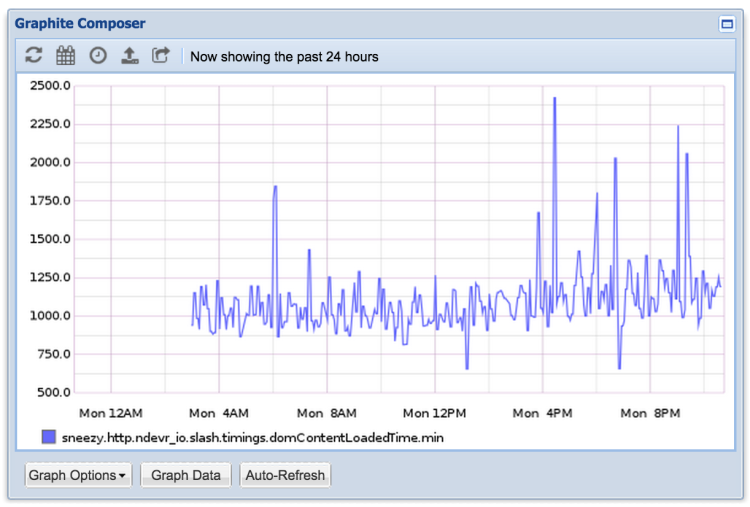
Graphite Results
http://graphite (gives you access to your Graphite data)
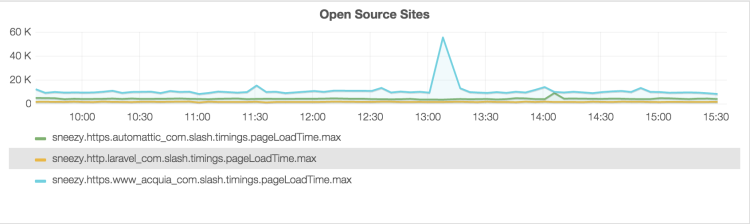
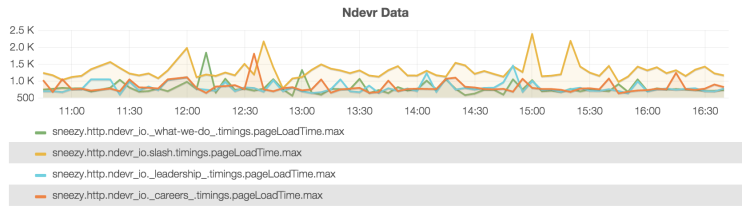
Grafana Results
http://grafana:3000 (gives you access to your Grafana dashboard admin)
4) Edit the sample_cron.sh
We’ve provided a few extra commented out lines in the script for use as examples, but here are the documented sitespeed.io configuration options. We use this file to point sitespeed.io to our local environments while sending the Graphite data to our hosted instance so we can share/compare our data better.
5) Oops
That’s fine, that’s why we are using Vagrant. If you find yourself making to mistakes to back out from simply destroy the VM and start again. You’ve likely made some customizations to the sample_cron.sh file, so keep those handy when you start over.
What’s Next
In future posts we’ll dive deeper in to the metrics we analyze and how we customize our reports and dashboards. This is still a work in progress for us, so we welcome pull requests or feedback of any kind.